
Debugging with agents, à l'envers: MCP in, or DAP out? 🐛
Last month I built acpdbg: a debugger that hands its stopped state to a coding agent over ACP, so the agent can look at the crash and even drive lldb. I liked it. And while playing with an agent living inside the debugger, the obvious next thought showed up.
I already have a Claude Code or a Copilot session open most of the day. So: why
not have my debugging session expose a few MCP tools — bt, frame variable,
p some_expr, step — and let the agent I already have open just call them? The
debug session becomes an MCP server; my chat agent picks up debugging superpowers.
It’s tempting. It’s also, I think, backwards.
Thinking à l’envers
À l’envers — “the wrong way round.” Here’s the tell. In acpdbg the debugger reaches out to the agent: the debugger is the ACP client, it wakes the agent up when the program stops. The MCP-server idea keeps that same shape — I, sitting at a stopped process, push tools up to whatever chat agent happens to be open. It’s human-in-the-loop, and it’s per-agent: I’d wire an MCP surface for Copilot, then again for Claude, then again for the next one.
But an agent that debugs autonomously doesn’t want to be handed tools by me. It wants to reach into the debugger itself — set a breakpoint, run to it, read a frame — on its own initiative. That’s the arrow flipped: the agent as the client, the debugger as the server it drives.
And I don’t need to invent a protocol for that. It exists.
DAP already did the hard part
The Debug Adapter Protocol is what VS Code and friends use to talk to any debugger without knowing anything about it. Write one adapter per debugger, one client per editor, and they all interoperate — the same N×M collapse I liked about ACP for editors and MCP for tools, but pointed at debuggers.
If the agent speaks DAP, it isn’t tied to my open session or to one vendor’s tool list. Every language with a debug adapter is suddenly reachable — LLDB for native code, Delve for Go, debugpy for Python — through one interface. The debugging capability lives in the agent, not in a bridge I re-bolt onto each chat.
Agents already speak it
This isn’t hypothetical. oh my pi (omp,
omp.sh) is a terminal coding agent with native DAP support —
around twenty-seven operations — so it can attach to a real debugger, set
breakpoints, pause, inspect frames, read locals, evaluate expressions and step,
all on its own. For the usual suspects it works well.
So I did the obvious thing: I pointed it at an unusual language.
The 4D try
4D Server ships its own DAP server — it just listens on a fixed port (19815),
while omp likes to pick DAP ports dynamically. So the whole thing came down to a
tiny (~120-line) TCP bridge: omp-4d-dap.
Point omp at a port of its choosing, forward to 4D’s, and the agent is talking DAP
to a live 4D application.
And it works. With the bridge I got real live debugging of a running 4D app,
driven by the agent: set breakpoints, step line by line, pull stack traces, and
read state — the way you’re supposed to on this platform — through evaluate with
context:"watch", which returns both the value and its 4D datatype.
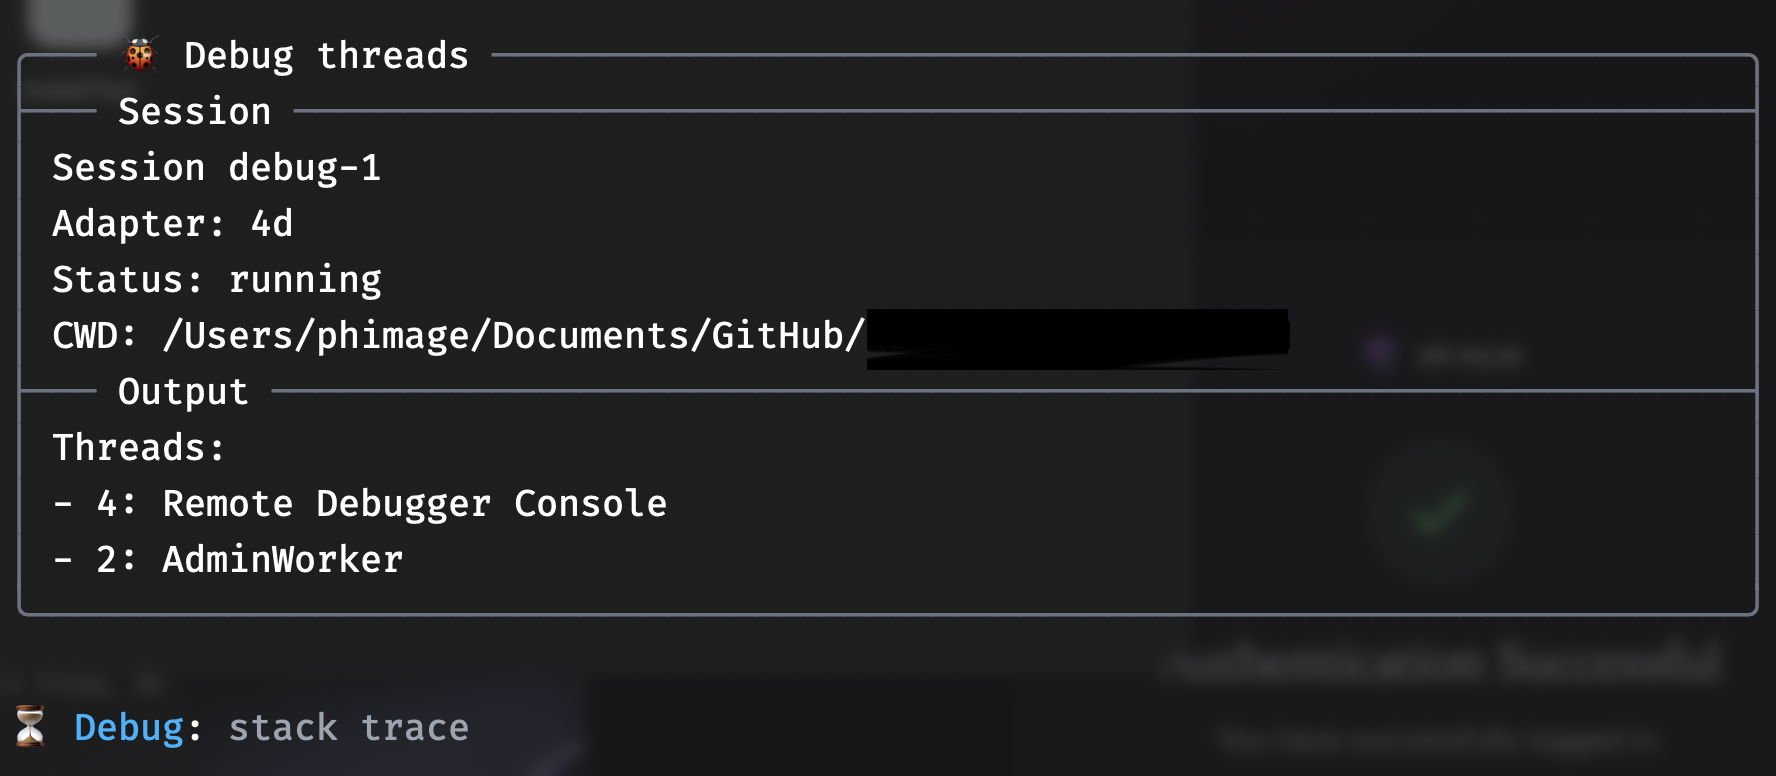
The agent’s own Debug threads call: adapter 4d, session running, real threads
listed — then it goes for the stack trace. No editor, no me in the loop.
…with honest gaps
Not everything is there yet, and I keep a running list in the
supported-operations doc.
The short version: scopes/variables time out (hence the evaluate/watch detour),
there’s no pausing a running debuggee, 4D Server never emits a clean termination
event (the client learns it’s done by timing out), and the REPL runs code but
hands back an empty result. You also have to set every breakpoint before you let
the code run. Live debugging, with caveats.
But most agents don’t speak DAP — yet
Here’s the catch that brings my “backwards” idea back from the dead: omp has DAP inside. Claude Code and Copilot don’t. So the clean, universal path only works today for the handful of agents that ship a DAP client.
For everyone else, the pragmatic bridge is exactly the thing I called à l’envers — you meet the agent where it already is. Two ways to do that right now:
- Documented skills — teach the agent how to debug in prose: the commands,
the workflow, the platform’s quirks (on 4D: set breakpoints first, read state
through
evaluate/watch). The agent runs a debugger through the shell it already has. - An MCP debug server — expose
set_breakpoint,step,evaluate,backtraceas MCP tools, and any MCP-speaking agent picks them up. Which, yes, is my original idea — only now framed as the fallback for DAP-less agents rather than the main event.
So it’s not one arrow or the other. It’s: DAP when the agent has it, MCP or skills to bridge the ones that don’t — ideally over the same debug backend underneath.
Update (Aug 10, 2026): I’m going to actually try that MCP-debug-server side — oh-mcp-dap (a wink at oh my pi): an experiment that wraps a DAP backend as an MCP server, so DAP-less agents like Claude Code or Copilot get the same debugging tools omp has natively. Same debug backend underneath, exposed the other way round. I’ll report back.
So which way round?
I lean toward DAP for anything autonomous: an agent that has it shouldn’t wait for me to hand it a debugger. But most of the agents I actually use don’t have it yet, so the MCP-tools-and-skills bridge is what gets Claude Code or Copilot debugging today. And I’m not throwing acpdbg away either — when I’m at the crash, the debugger-drives-the-agent loop still feels right. It’s a try, in every direction.
Bridge and caveats: github.com/mesopelagique/omp-4d-dap. Tell me which way round you’d build it. 🐛
← Back to all writing